PreAlignment QC
Assessment of data quality can be an important stage of any project involving NGS data. It is common practice to perform a pilot experiment on a relatively small number of samples and assess data quantities and quality before proceeding with a larger more expensive experiment. Issues to consider during the quality assessment / quality control stage:
- Are there any fundamental library construction issues that may affect sensitivity and specificity of the results?
- Are the DNA/RNA fragments of expected/sufficient length? What does the fragment size distribution look like?
- Does the individual read length make sense for the fragment size?
- Are there a lot of adapter sequences in the reads?
- What is the complexity of the library? Are there a lot of duplicate reads?
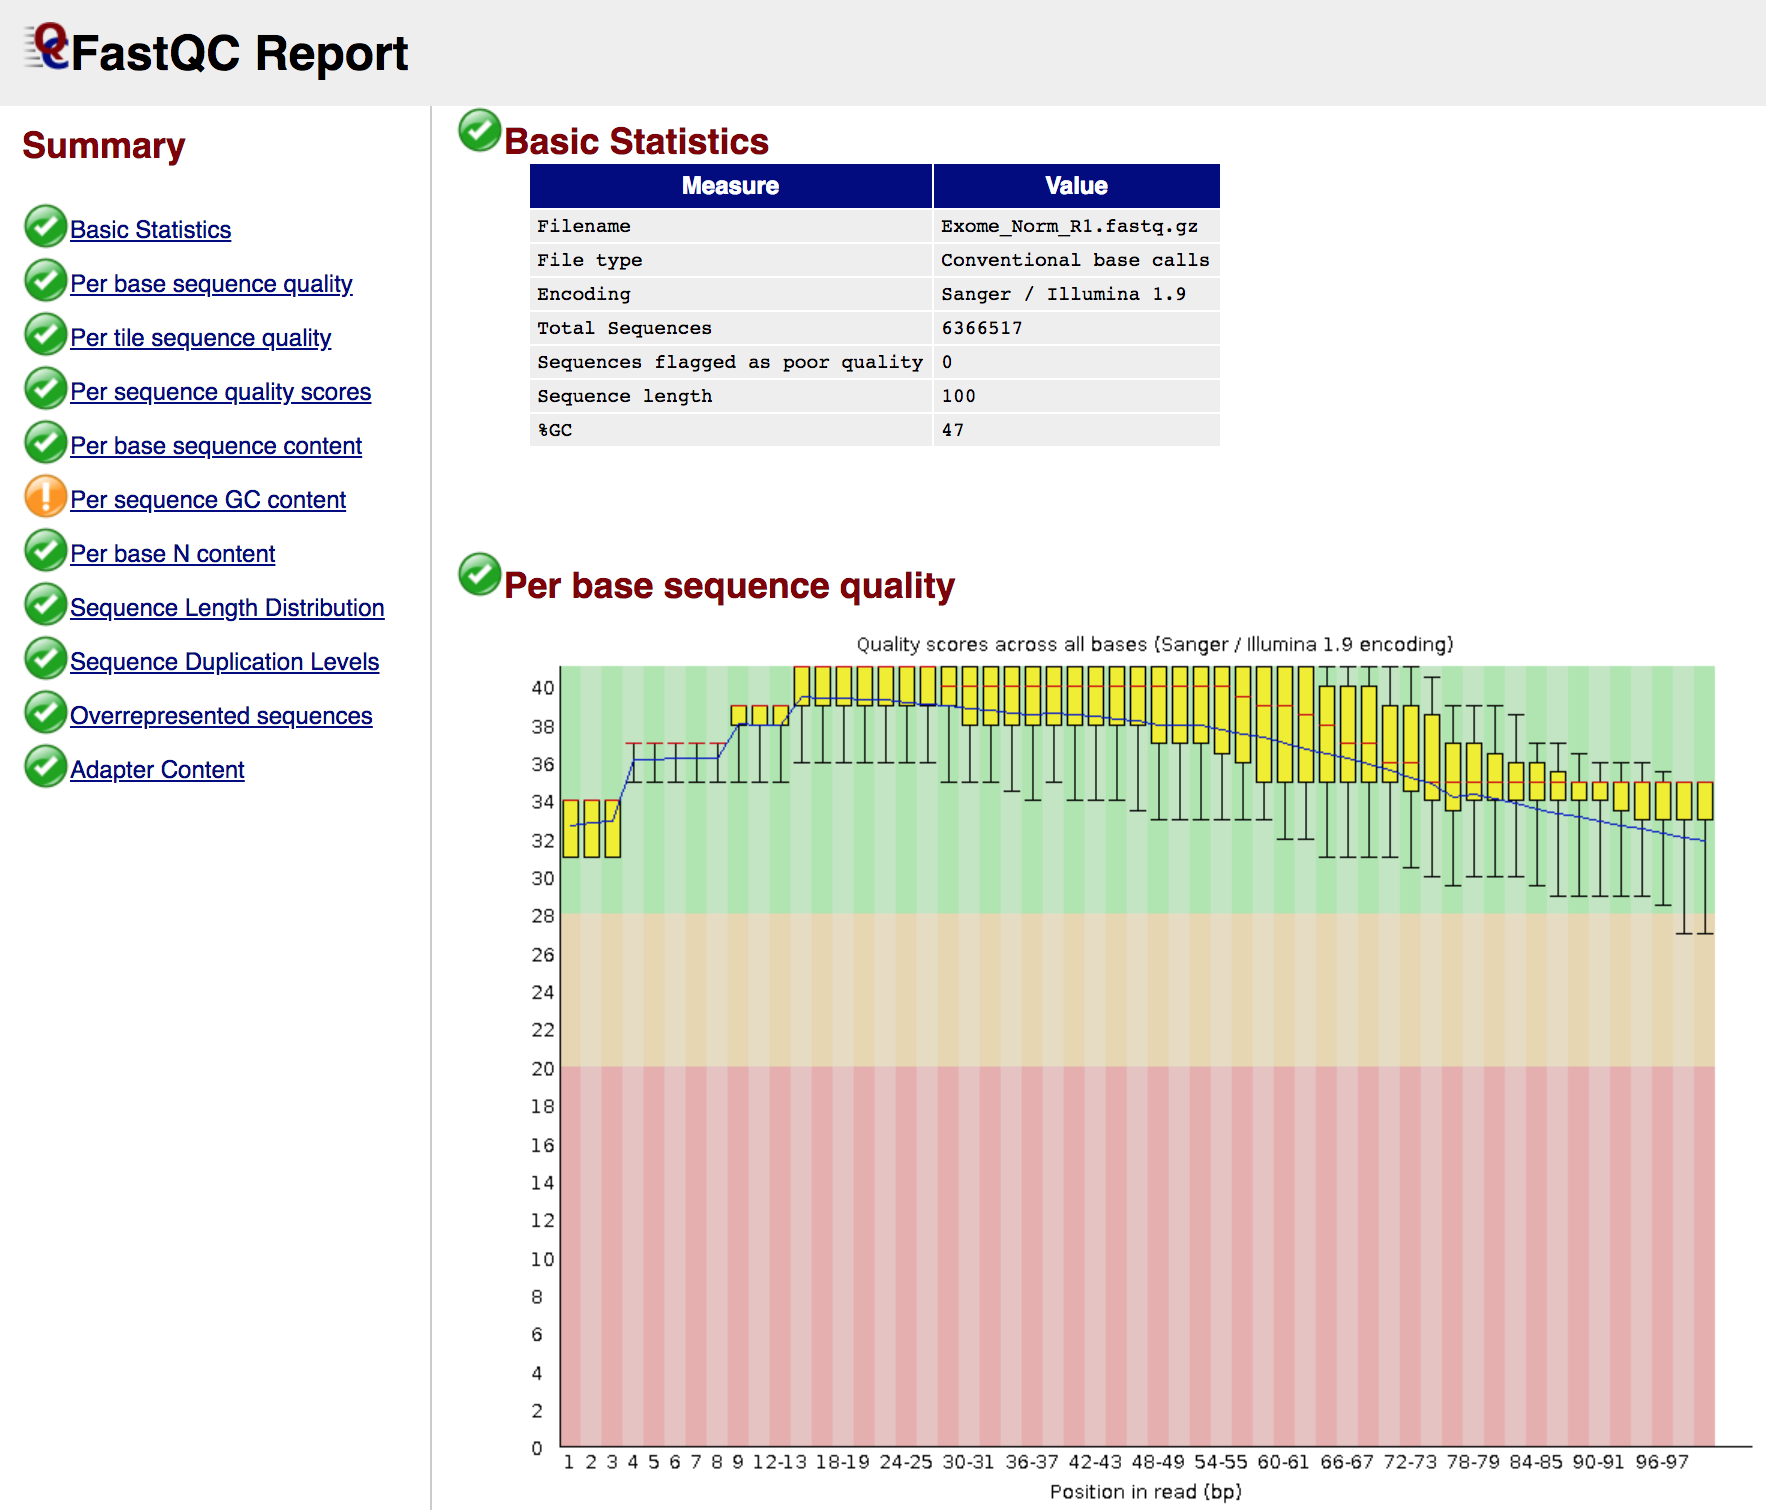
- What does the sequence base error profile look like? Are there problematic positions in the sequence run that affect many reads? Are there a lot of N’s? Is the overall base error rate unusually high? Does the base quality at the ends of each read become problematic?
- Do you have enough data to achieve experimental objectives? All of the above points (and more) may influence the amount of effective data obtained. How this is assessed really depends on the objectives. For example, if you goal it to identify germline variants you might determine average coverage and aim to achieve >20-30x. The rationale for such targets is not well documented in publications that examine the effect of coverage on variant calling sensitivity. In tumor/normal sequencing for somatic variants you might have higher targets depending on tumor purity and heterogeneity, and the target might differ for tumor and normal (e.g. 30x normal, 50x tumor). In RNA-seq you might assess detection of genes critical to your biological system or area of research interest.
Use fastqc to produce base quality metrics for each FastQ file
In the following section we will use the FastQC tool to produce a simple html report on each FastQ file.
cd /workspace/inputs/data/fastq

fastqc Exome_Norm/Exome_Norm*.fastq.gz
fastqc Exome_Tumor/Exome_Tumor*.fastq.gz
tree

fastqc WGS_Norm/WGS_Norm*.fastq.gz
fastqc WGS_Tumor/WGS_Tumor*.fastq.gz
tree

fastqc RNAseq_Norm/RNAseq_Norm*.fastq.gz
fastqc RNAseq_Tumor/RNAseq_Tumor*.fastq.gz
tree
View a FASTQ report
In the next exercise, we are going to use multiqc to compile the FastQC results into a nice visual report, but just so you know what the FastQ result looks like, try loading one of them in a web browser (e.g. Chrome). First go to the following URL in your browser and navigate to an individual report for one of the data types (e.g. Exome Normal):
- http://s#.pmbio.org/inputs/data/fastq/
- http://s#.pmbio.org/inputs/data/fastq/Exome_Norm/Exome_Norm_R1_fastqc.html
Use multiqc to produce a combined report of these QC files
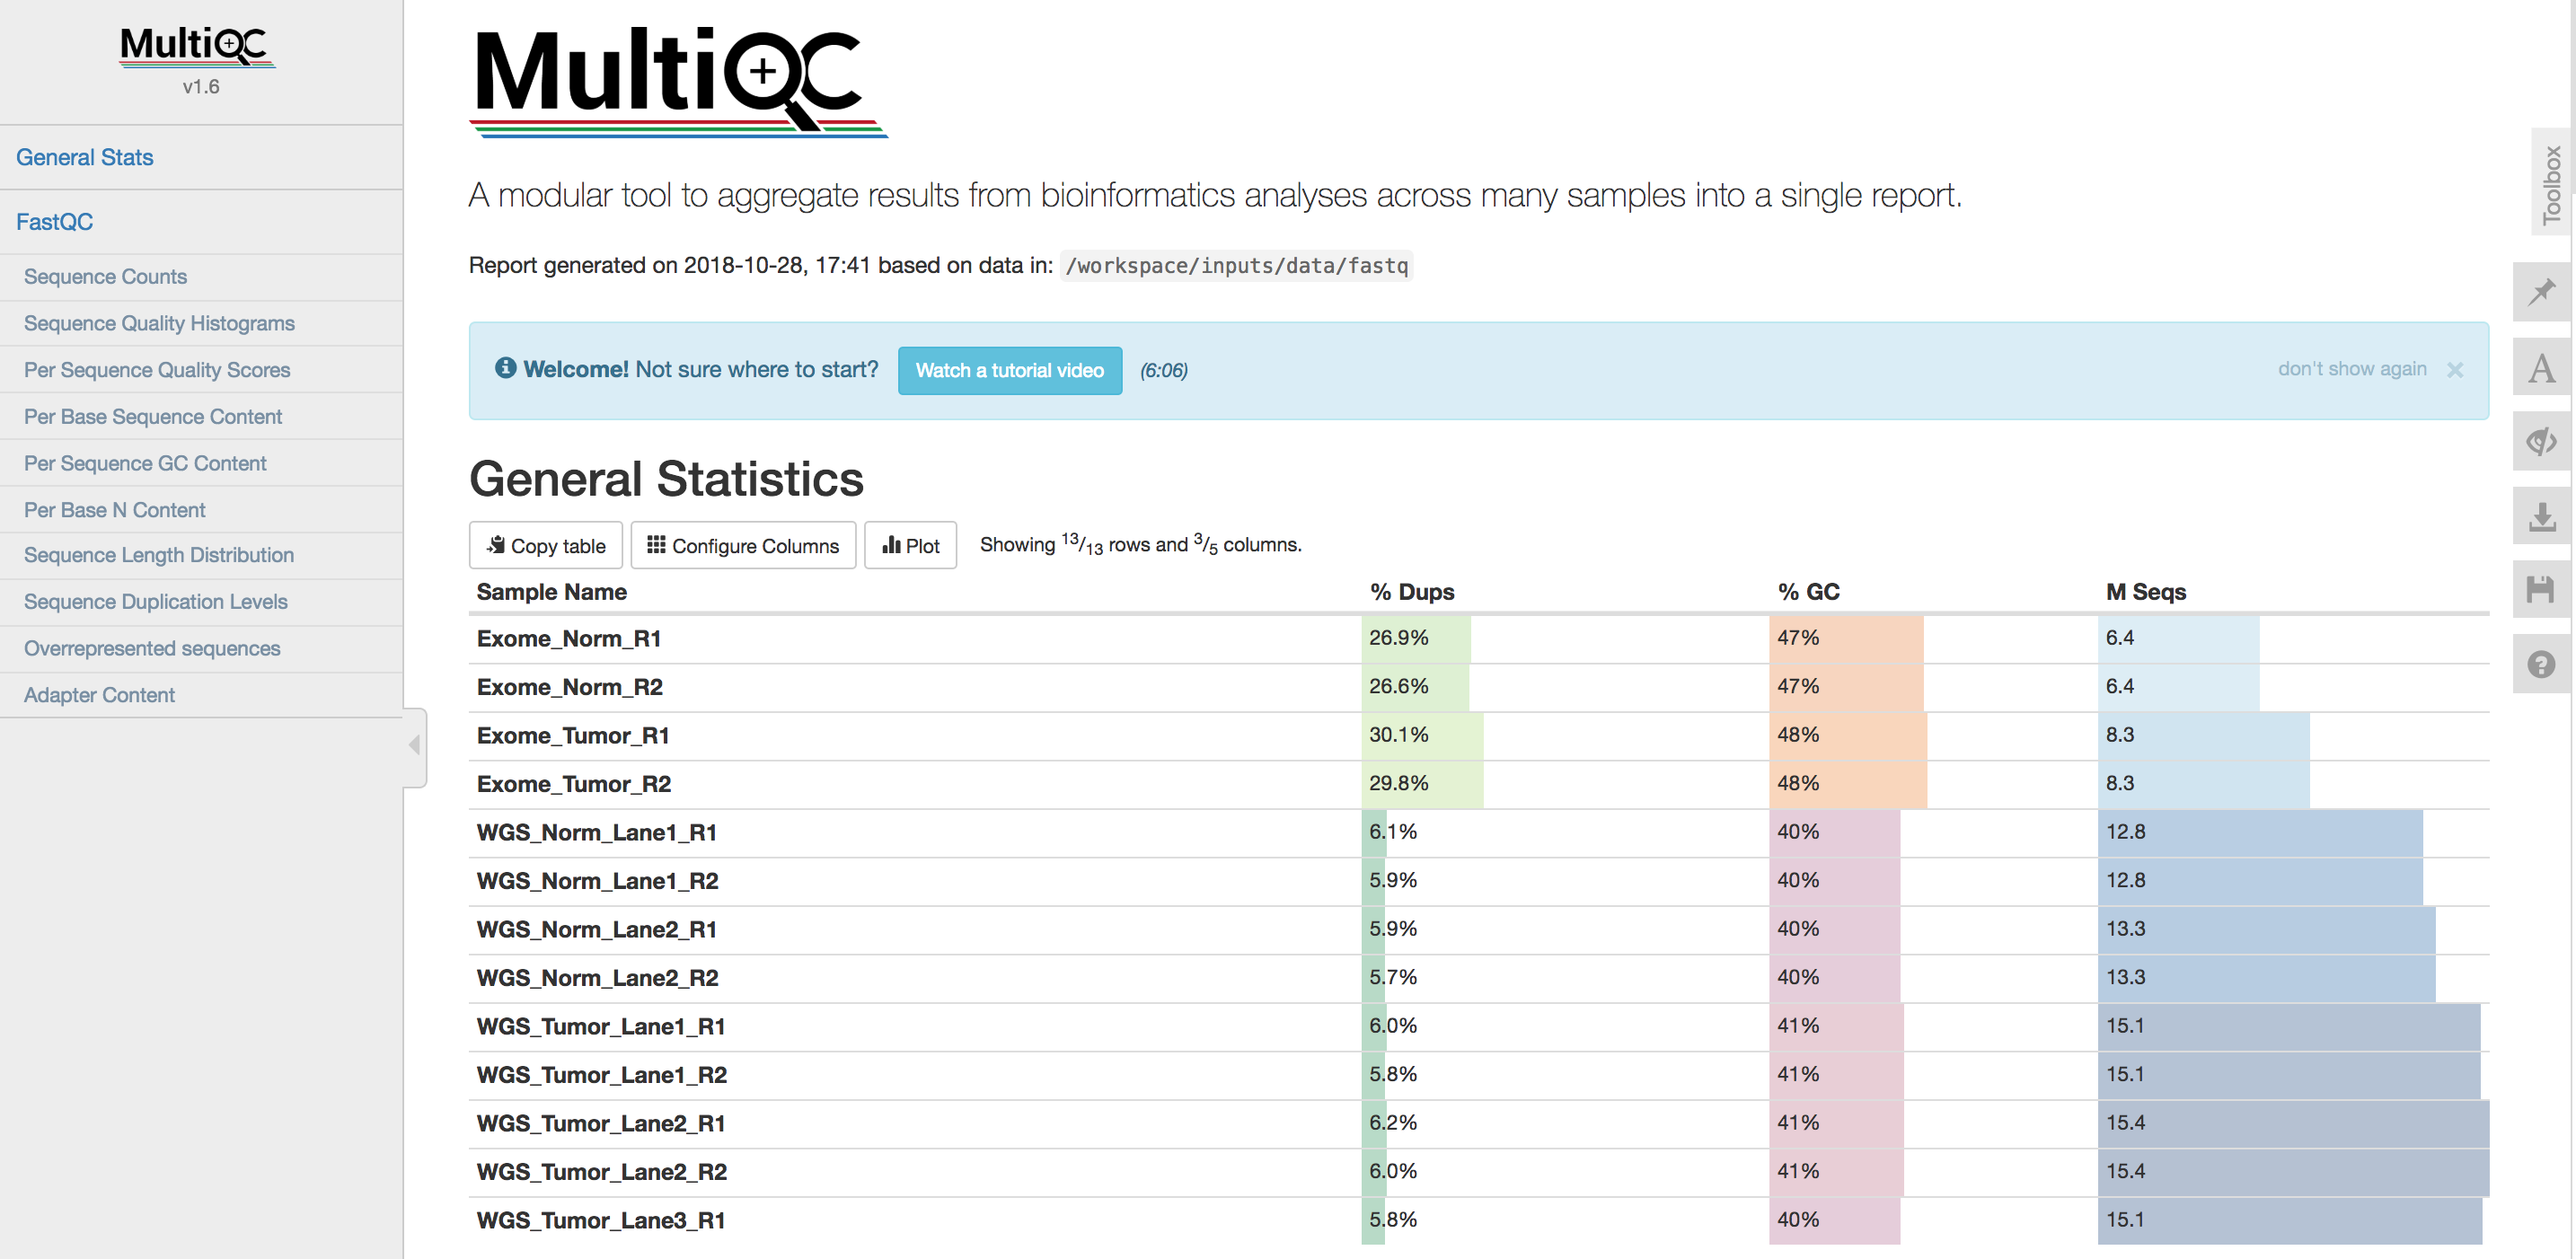
In the following section we will gather all the html QC report from FastQC above together and use MultiQC to produce a summary of them.
cd /workspace/inputs
mkdir qc
cd qc
multiqc /workspace/inputs/data/fastq/
tree
Explore the QC results in your browser
Spend some time exploring results by loading the following URL in a web browser (e.g. Chrome):
- http://s#.pmbio.org/inputs/qc/multiqc_report.html
Don’t forget to use your own student number in place of #.
Try to cover the following in your explorations:
- Watch the short tutorial video (we will can do this as a group)
- Look at some results that correspond to the three data types: exome, WGS, and RNA-seq types
- What is the pattern of % duplicates (
% Dups) across the data types? Does that make sense? Why? - What is the pattern of % GC across the data types? Does that make sense? Why?
- Look at some results for R1 and R2 for a particular data type
- For samples that have multiple lanes, do the lanes seem consistent to each other?
- Where do we tend to see adapter sequences with respect to read position?